
The infrastructure that makes the closed loop possible.
We don't have to guess who cares about your message. We’ve spent the last decade asking, modeling, and verifying across every adult in America.
What we’ve built.
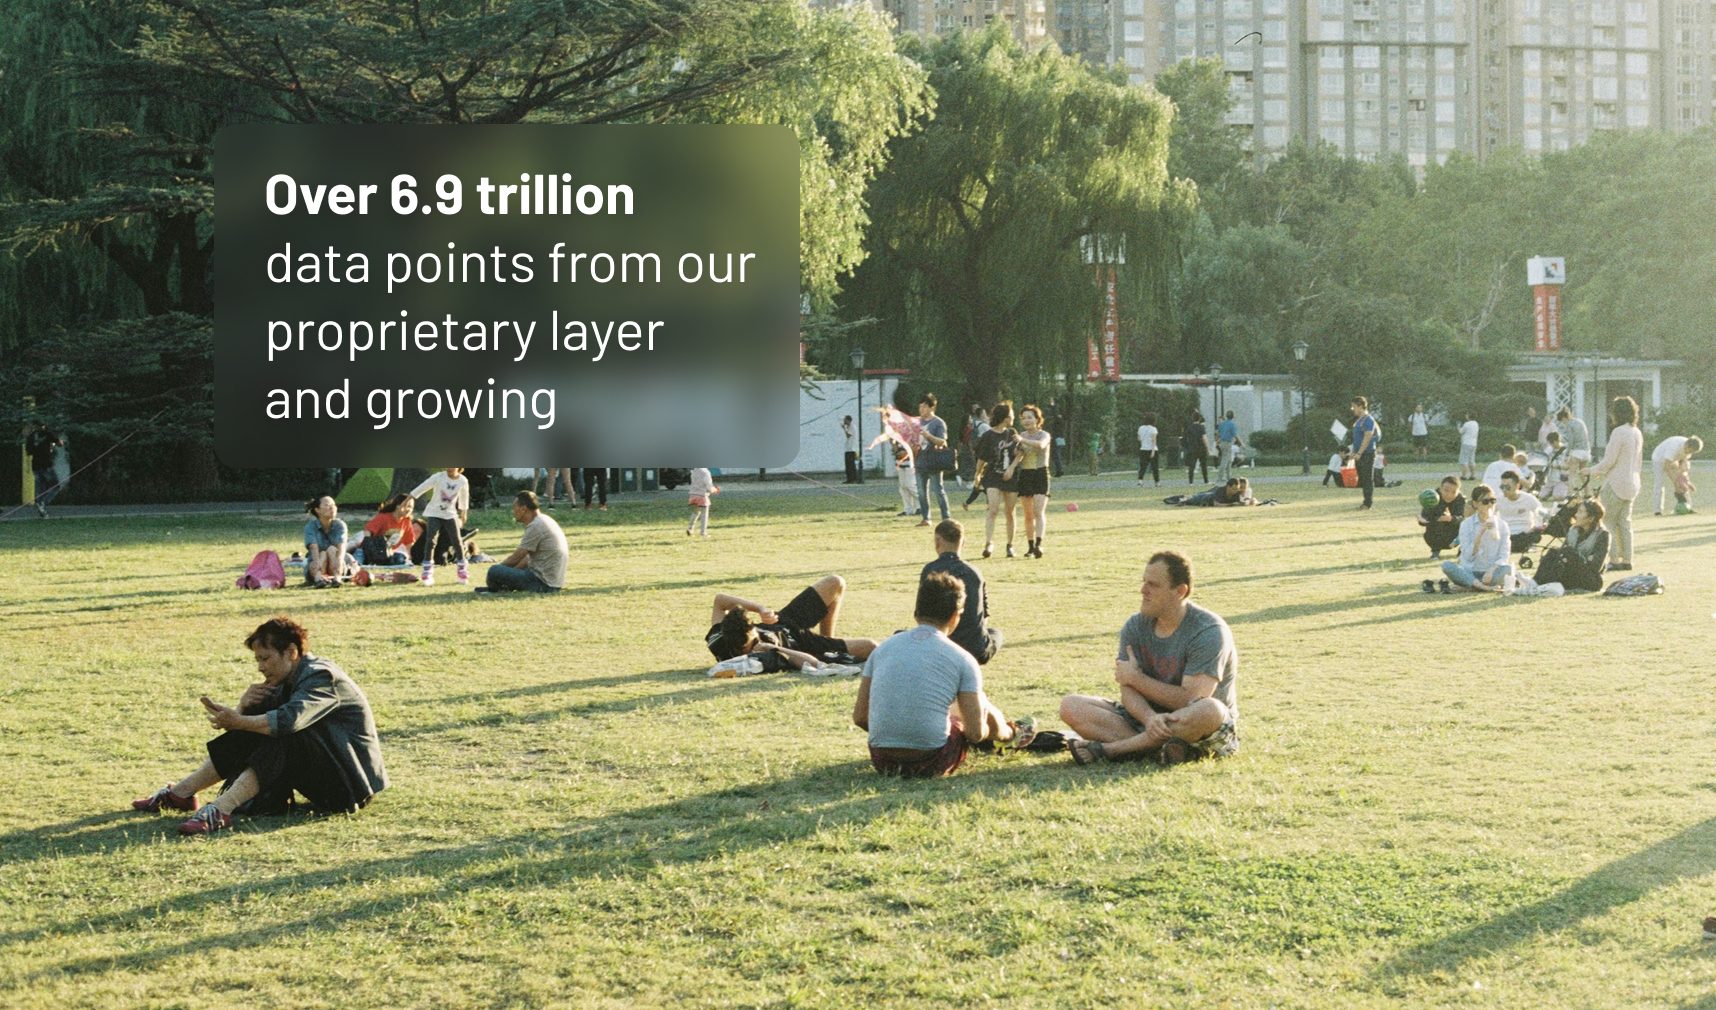
Most industries are running on fragmented or single-sourced data. Tunnl is unifying intelligence across the identity sources that matter most. The result is a single, continuously verified data asset, built over a decade.
Addressable
A dataset of every U.S. adult, enriched with proprietary and third-party data, unified into one system. This includes records for every registered voter.
- Consumer Data
- Voter Data
- Census Data
Proprietary
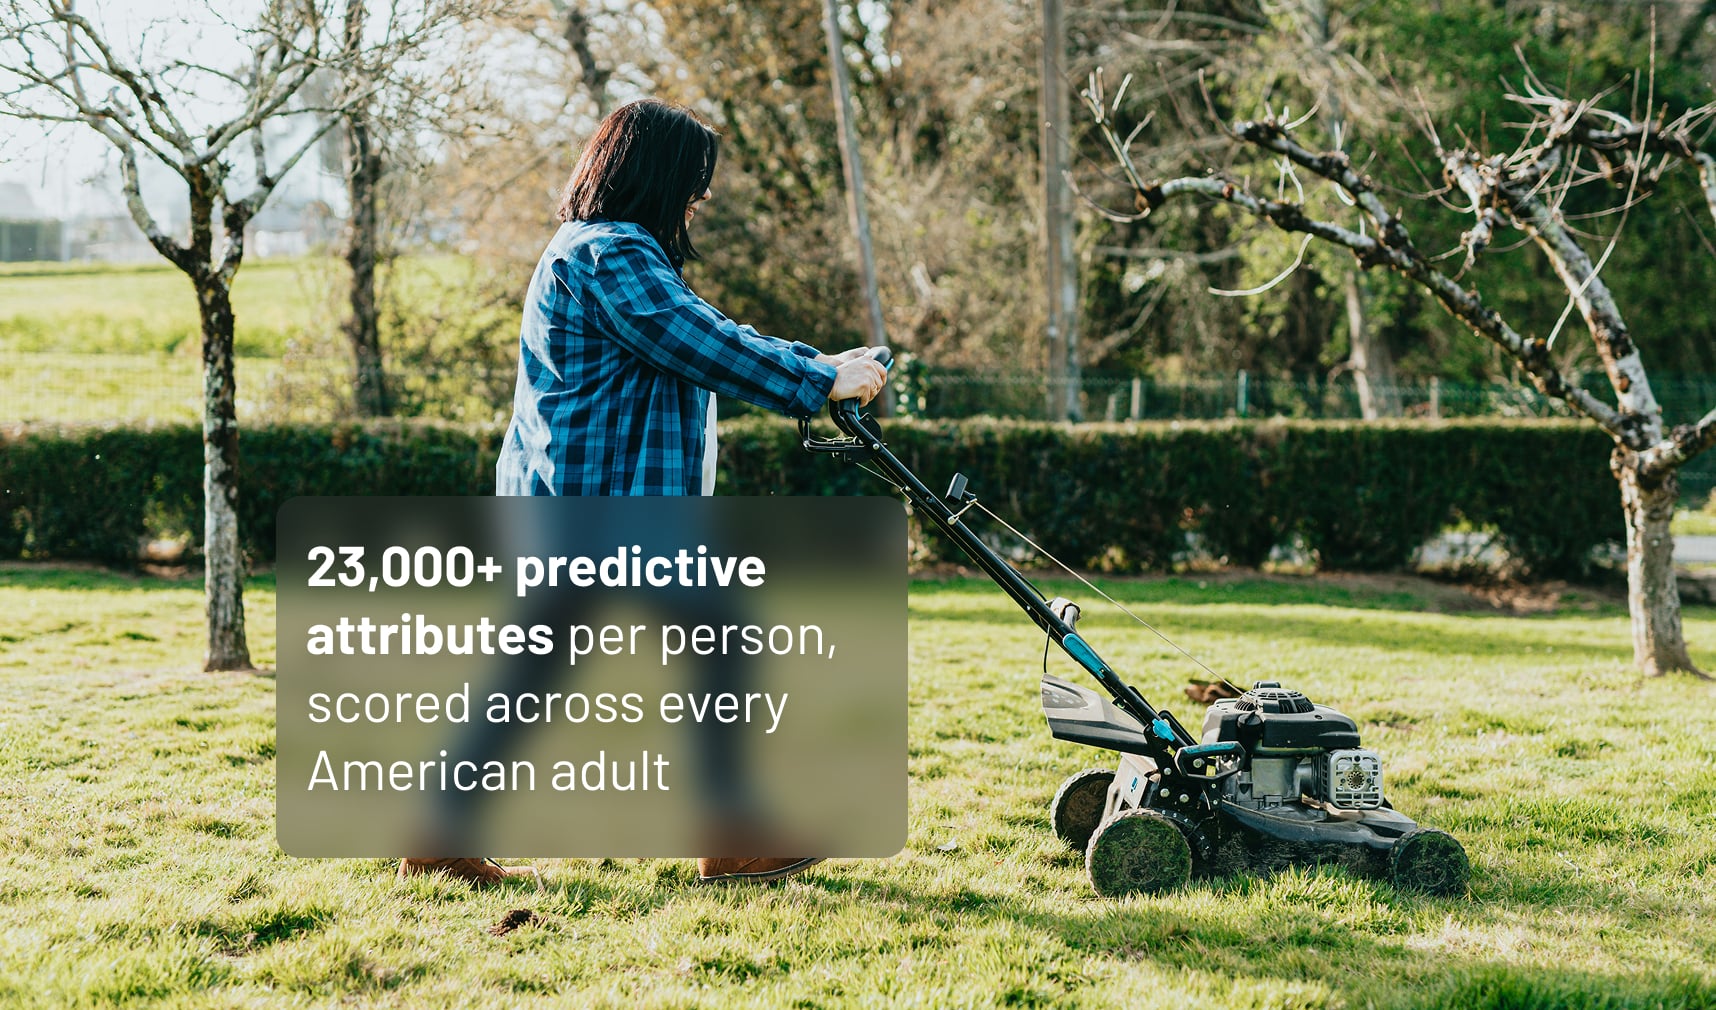
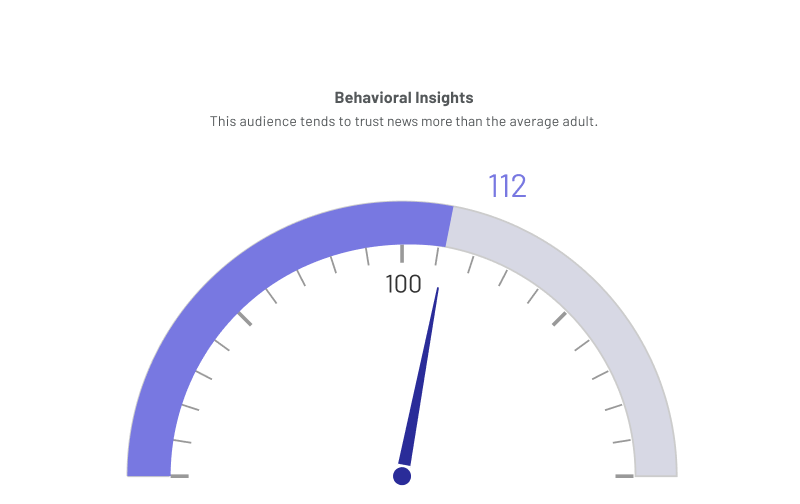
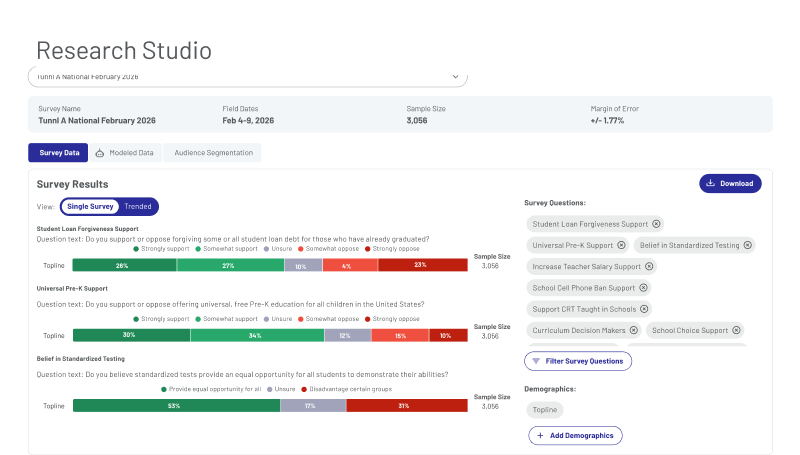
Every question we’ve ever asked has been modeled across every adult in America. That means a decade of continuously updated survey research has been fed into an AI modeling engine that generates and refreshes predictive models at scale.
- Ongoing Survey Data Collection
- AI-Powered Modeling
- Model Validation
Influence
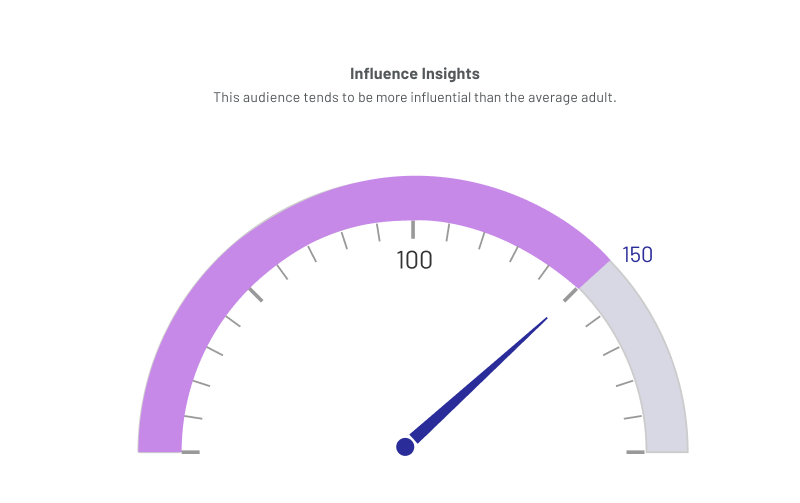
Data on leadership, professional identity, and influential behavior, helping you understand not just who your audiences are, but how they lead and engage.
- LinkedIn Data
- Leadership and Industry Data
- Influential Behavior Models
Media
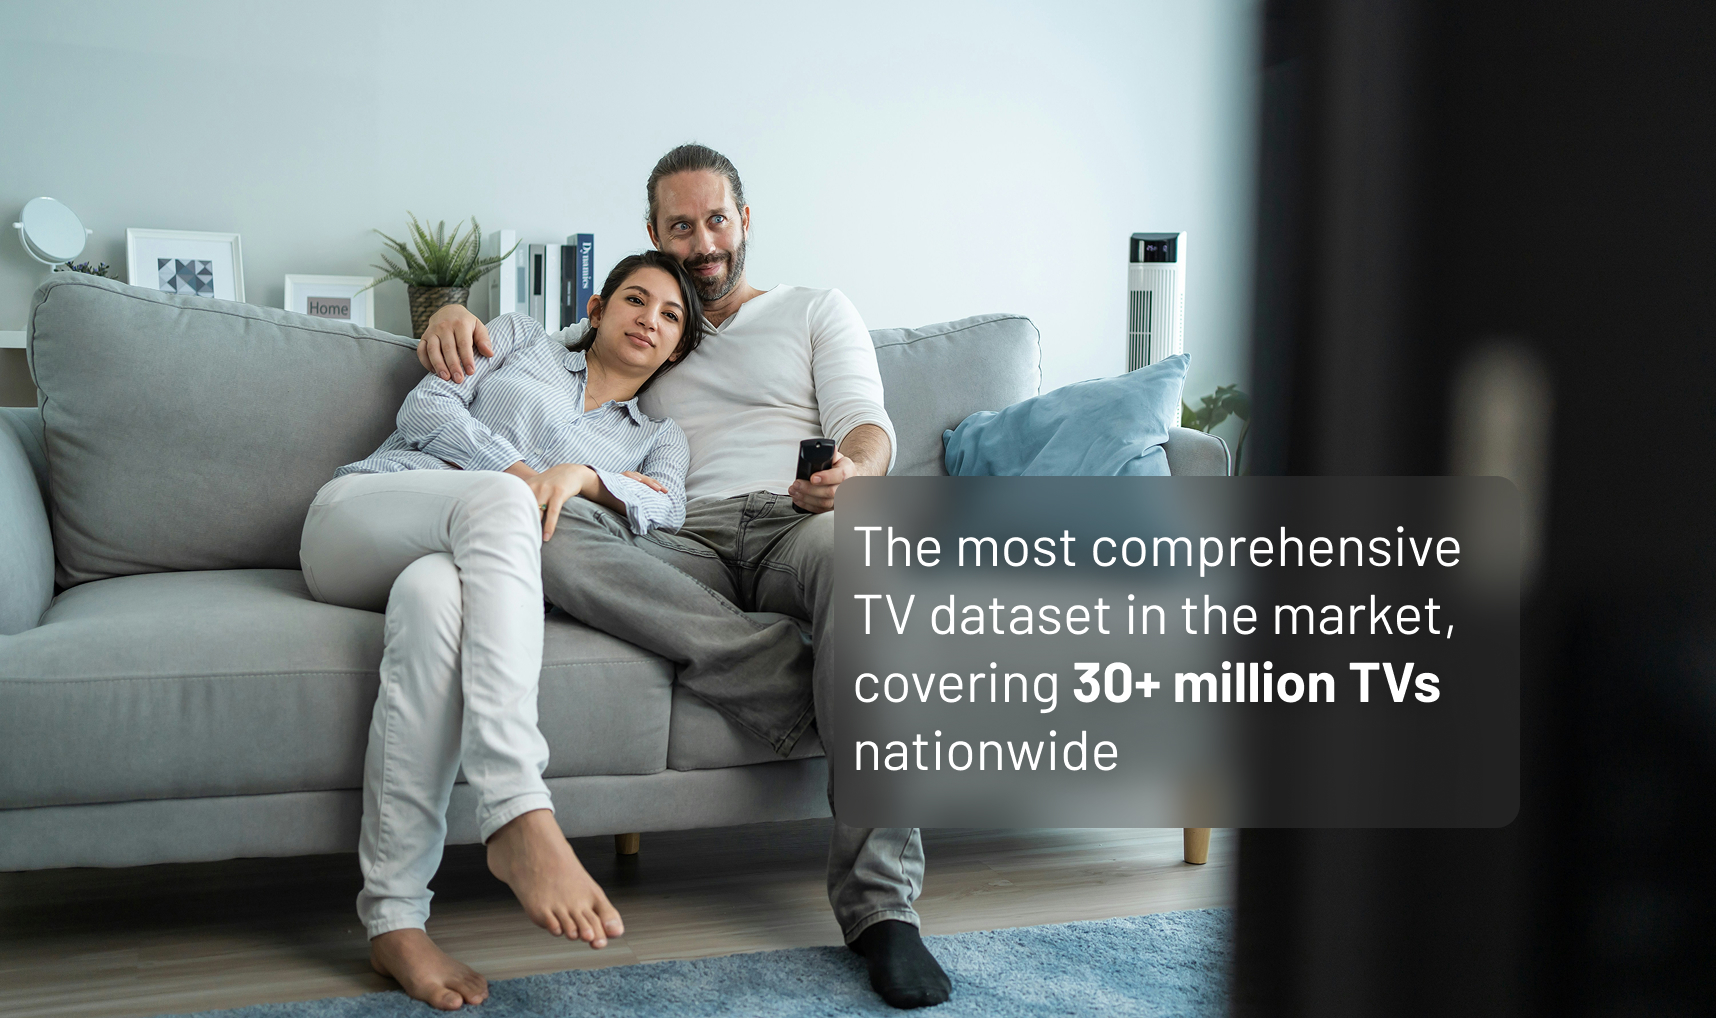
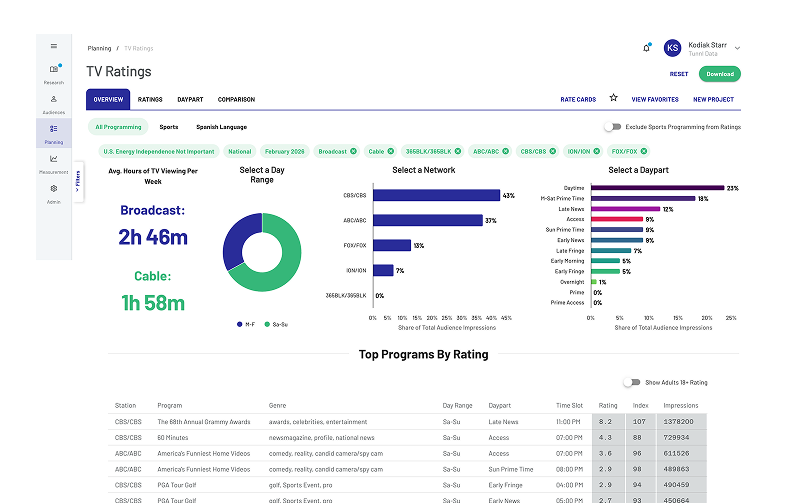
A media dataset built across screens. Tunnl’s media layer combines observed and stated consumption across screens. The TV dataset covers 30M+ TVs nationwide, giving you a detailed view of local and national viewership across screens. Recurring surveys calibrate media consumption for every day streaming platforms, social media, and other usage.
- Automatic Content Recognition (ACR)
- Set Top Box (STB) TV Data
- CTV Data
- TV Ad Occurrence Data
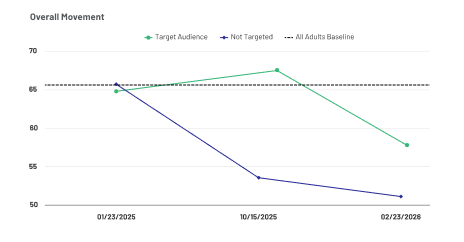
Longitudinal behavioral data
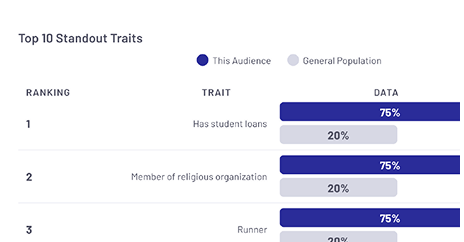
Individual-level predictions
A closed feedback loop