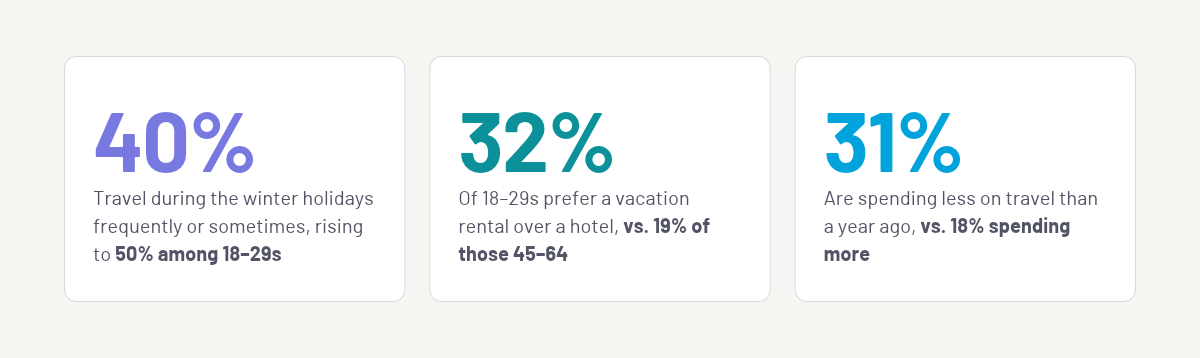
Four in 10 Americans travel during the winter holidays. Under-45s lead the way, and they're also the ones most likely to be spending more on travel than they did a year ago, even while nearly 1 in 3 Americans are cutting back. We surveyed 3,018 U.S. adults this October to find out who's actually traveling this season, where they're staying, and how far their budgets stretch. The answer is a narrower, younger audience than a blanket "holiday travel" campaign will ever reach.
 How many Americans are actually traveling this holiday season?
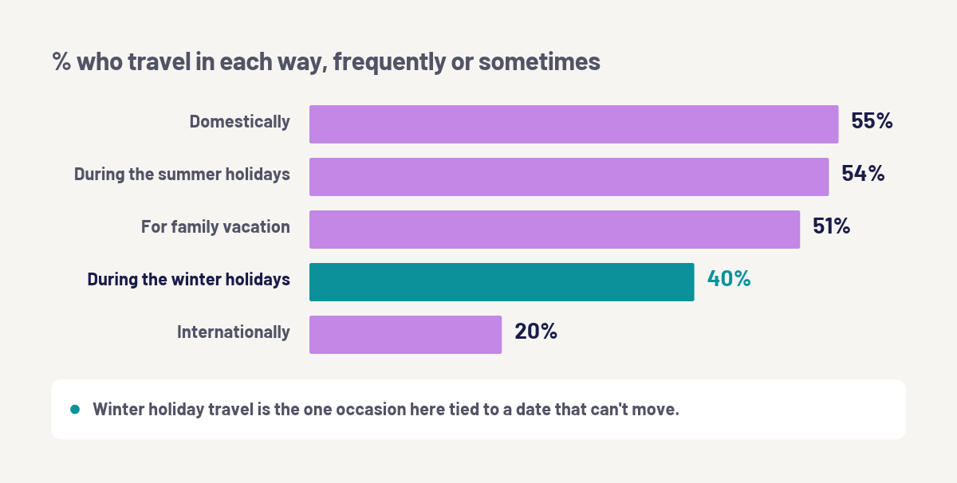
Winter holiday travel trails the rest of the calendar. 55% of Americans travel domestically and 54% travel during the summer holidays at least sometimes, both ahead of the 40% who travel over the winter holidays. Family vacations sit at 51%, international trips at 20%.
Still, 40% is 2 in 5 adults, and winter holiday travel is the one occasion here tied to a date that won't move. Miss the window and there's no second shot, the way there might be with a summer trip that slips a month. So the real question isn't whether people travel. It's who.
Who's leading the holiday travel surge?
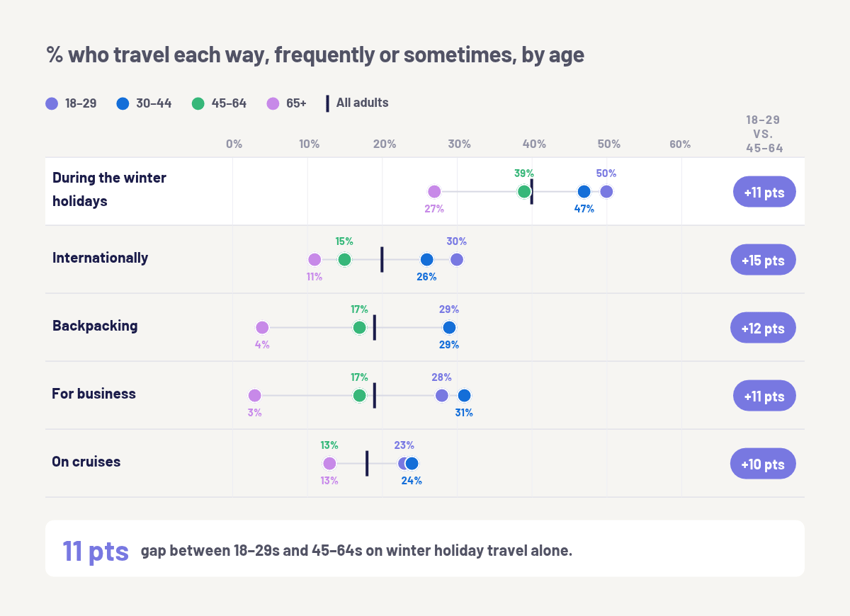
Under-45s, by a wide margin. Half of 18–29-year-olds and 47% of 30–44-year-olds travel during the winter holidays, compared with 39% of 45–64s and just 27% of those 65 and older. That's an 11-point gap between the youngest and oldest adult travelers, and it holds up across the board.
18–29s are 15 points more likely than 45–64s to travel internationally (30% vs. 15%), 12 points more likely to go backpacking (29% vs. 17%), 11 points more likely to travel for business (28% vs. 17%), and 10 points more likely to take a cruise (23% vs. 13%). Every comparison points the same direction.
Treat "holiday travelers" as one broad audience and you're overspending on the group least likely to book, and underspending on the one most likely to.
Hotel or rental: where are younger travelers staying?
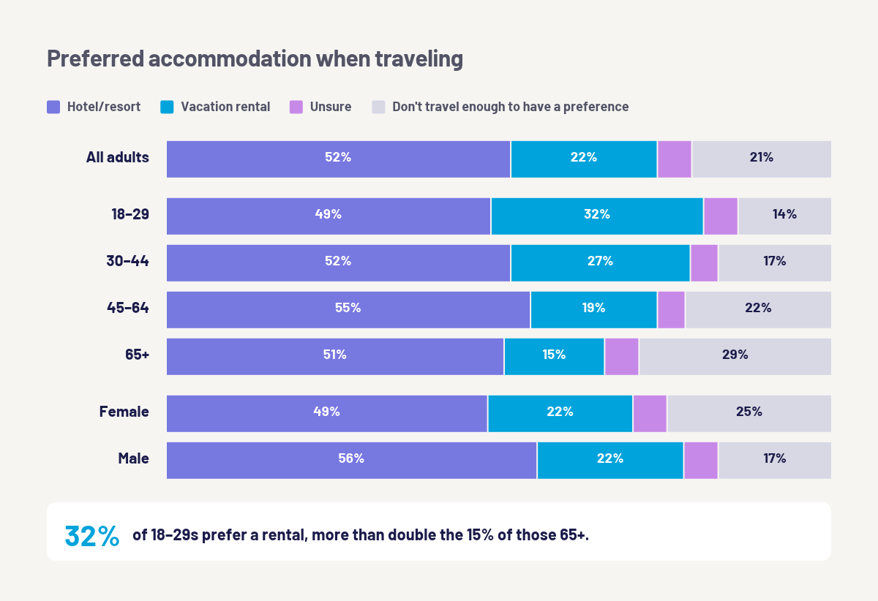
Hotels still win overall. 52% of Americans prefer a hotel or resort over a vacation rental, and that holds across every age group, from 49% of 18–29s to 55% of 45–64s. Look at the alternative, though, and the age gap reopens. 32% of 18–29s prefer a vacation rental like an Airbnb or Vrbo, roughly twice the 15% of those 65 and older who say the same.
Hotels aren't going anywhere. But if vacation rental growth is coming from anywhere, it's the under-30 traveler trading housekeeping and a pool for extra space and a kitchen.
Will tighter budgets slow the season down?
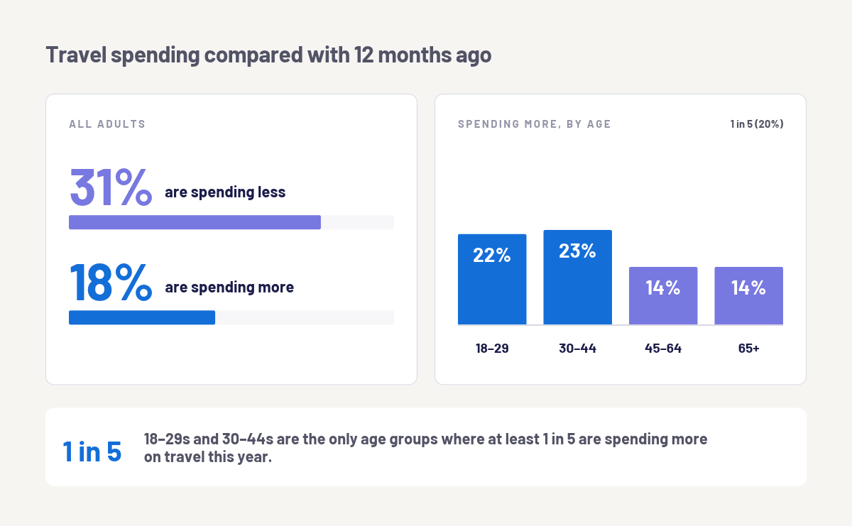
For a lot of Americans, yes. Nearly 1 in 3 (31%) say they're spending less on travel than they were a year ago, compared with just 18% spending more. That pullback outpaces most other discretionary categories we asked about.
That pressure isn't spread evenly, though. 22% of 18–29s and 23% of 30–44s say they're spending more on travel this year, compared with roughly 14% of adults 45 and older. The audience with the most room to spend this holiday season is also the one most likely to actually travel. That makes under-45s a double opportunity, not just a bigger one.
Does having kids at home mean more holiday travel?
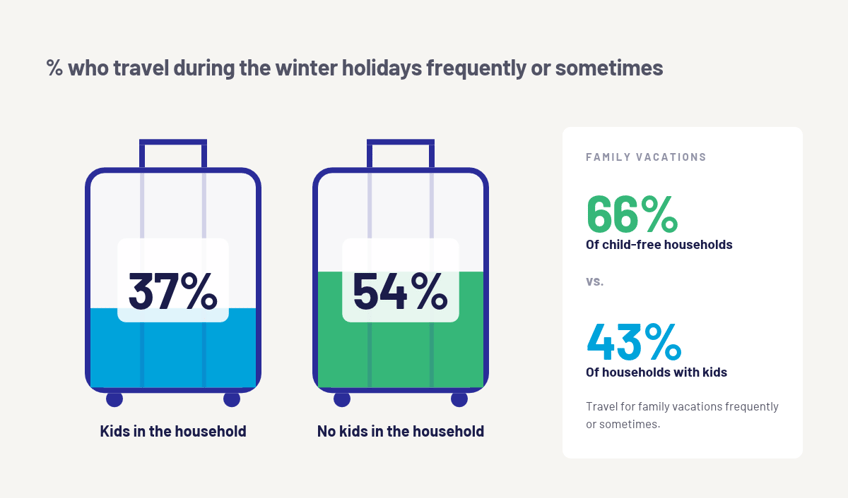
Less than you'd think. Households without kids at home travel during the winter holidays at nearly one and a half times the rate of households with kids: 54% vs. 37%. The gap holds for family vacation travel too. 66% of child-free households travel for family vacations frequently or sometimes, compared with 43% of households with kids.
It tracks once you think about who actually makes up "no kids in the household": younger couples who haven't had kids yet, and older adults whose kids have moved out. Both have fewer scheduling constraints over the holidays than parents juggling school breaks and a houseful of their own logistics. Don't default to parents with young kids as your core holiday traveler. The audience with the time and flexibility to actually book a trip looks different.
What this means for travel & hospitality brands
1. Lead with under-45s
Half of 18–29s and 47% of 30–44s travel over the winter holidays, compared with 27% of adults 65+. They’re also the most likely to take bigger trips, like international travel and cruises. Make them your primary audience, and sell them the upgrade, not the discount.
2. Make room for rentals
32% of 18–29s prefer a vacation rental, compared with 19% of 45–64s. Hotels should promote what rentals win on, like space, kitchenettes, and group rates. Rental platforms should target younger travelers planning holiday trips with friends.
3. Target as budgets tighten
Nearly 1 in 3 Americans are spending less on travel, but at least 1 in 5 under-45s are spending more. Use value messaging for travelers cutting back and experience messaging for those still spending. Broad reach can’t tell these groups apart; targeted audiences can.
4. Don’t assume parents are your core holiday traveler
Households without kids travel over the holidays at 54%, compared with 37% for households with kids. Couples, friend groups, and empty nesters deserve their own creative.
Download these insights
Download this in PDF form so you can bring these numbers into your next holiday campaign planning conversation. It covers how often Americans travel domestically, internationally, and over the holidays, plus an age breakdown showing where under-45s lead on holiday, international, and adventure travel.
Download our full insights here
If you’re interested in reaching these travelers directly, request a demo here. We’ll help you build a holiday travel plan around the audiences most likely to book.
Tunnl runs a national omnibus survey multiple times each month. This online survey of 3,018 U.S. adults was fielded October 19–22, 2026. Results are weighted to be representative of the national adult population. Some questions allowed multiple selections, so figures may not total 100%.